

Solar Panel Return on Investment
Solar panels are often marketed as an energy upgrade.
But financially?
They behave much closer to a long-duration infrastructure investment attached to your home.
And like any investment, the question serious homeowners eventually ask is simple:
👉 When does this actually pay for itself — and what happens after it does?
Because solar ROI is not just about breaking even.
It is about whether the system becomes a cash-flow-producing asset for decades.
This guide walks you through the real math, the hidden variables, and the financial mechanics that separate strong solar investments from mediocre ones.
No hype. No promises. Just the model.
The Executive Snapshot (Start Here)
Most residential solar systems in the U.S. tend to land within:
👉 Payback window: ~6–12 years
👉 Panel lifespan: ~25–30 years
👉 Post-payback benefit: Often 13–20+ years of reduced electricity costs
That structure alone explains why solar is increasingly evaluated alongside other household capital improvements.
But averages are not outcomes.
ROI is driven by variables — and understanding them is where smart buyers gain an advantage.
A Quick Reality Check Most Buyers Never Hear
Solar ROI is NOT primarily determined by panel performance.
It is shaped by five external forces:
✔ Local electricity rates
✔ Incentives and tax credits
✔ System cost
✔ Financing structure
✔ Energy consumption patterns
Notice what’s missing?
Panel brand.
Marketing tends to overemphasize hardware — when economics live elsewhere.
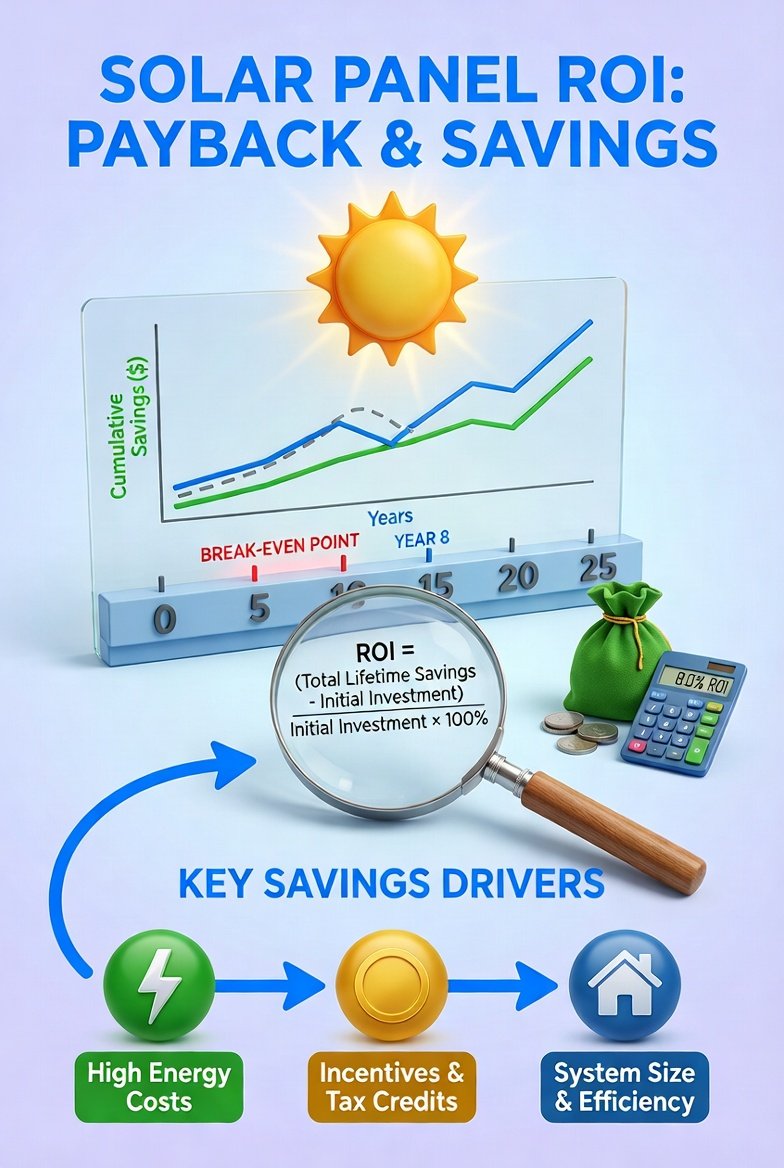
The Core ROI Formula (Simplified)
At its most basic level:
ROI = Total Lifetime Savings – Total System Cost
But professionals rarely stop there.
A more useful framing is:
👉 Payback Period = Net Cost ÷ Annual Savings
Where:
Net Cost = System price – incentives
This isn’t complicated math — but it is powerful clarity.
Example Scenario (Anchor the Numbers Early)
Let’s ground this with a realistic illustration.
Variable | Example Estimate |
System size | 7 kW |
Gross cost | $19,000–$23,000 |
Federal tax credit (if eligible) | ~30% |
Net cost | ~$13,000–$16,000 |
Estimated annual savings | $1,400–$2,100 |
👉 Estimated payback: ~7–10 years
After that threshold, the economics often shift dramatically in the homeowner’s favor.
Remember — this is illustrative. Actual outcomes vary by property and region.
Why Rising Utility Rates Quietly Accelerate ROI
One of solar’s least discussed advantages is inflation protection.
Electricity prices historically trend upward in many markets.
Each increase widens the spread between:
👉 what you generate
and
👉 what you would have paid.
Over long horizons, that compounding effect can materially improve lifetime returns.
Solar is partially an energy decision — but also a rate hedge.
The Variable That Moves ROI the Most: System Cost
Before modeling savings, anchor pricing.
Small pricing differences at installation ripple across decades.
Even a $2,000 delta can shift payback timelines noticeably.
Sophisticated buyers negotiate here — not after.
Incentives — The Immediate ROI Accelerator
Incentives function like upfront return.
They reduce the capital required to generate savings.
Explore your local landscape:
👉
When incentives are strong, solar’s financial profile often improves quickly.
When limited, timelines stretch — but may still remain attractive depending on energy costs.
Financing Changes the Equation (But Doesn’t Break It)
Many homeowners finance rather than pay cash.
Borrowing introduces interest — which affects total return — yet solar can still perform well when savings exceed financing costs.
If you haven’t evaluated loan mechanics yet:
Ownership typically preserves more upside than third-party arrangements, but structure matters.
Model before committing.
Cash vs Loan — A Simple Comparison
Purchase Method | Typical Payback | Lifetime ROI Potential |
Cash | Faster | Higher |
Loan | Slower | Moderate–High |
Lease/PPA | No payback (no ownership) | Lower |
None is universally “correct.”
But ownership aligns the asset with your balance sheet.
What Many ROI Calculators Miss
Online tools are helpful — but simplified.
They often struggle to capture:
- behavioral energy changes
- future rate shifts
- panel degradation
- maintenance
- policy evolution
Use calculators directionally, not definitively.
Solar modeling is probabilistic — not guaranteed.
Panel Degradation: The Slow Drift Most Systems Experience
Panels gradually produce slightly less electricity each year.
Field data commonly places degradation around:
👉 ~0.3%–0.8% annually
Modern equipment is engineered for durability, but acknowledging performance drift improves forecasting realism.
Good ROI models assume it.
How Long Do Solar Panels Last Financially?
While warranties often span 20–25 years, many systems continue producing beyond that.
Which creates an interesting financial shape:
Years 1–10 → cost recovery
Years 10–30 → potential value extraction
Long-duration assets behave differently than short-cycle purchases.
Patience is rewarded.
Maintenance — Smaller Than Most Expect
Residential solar typically requires limited upkeep.
Occasional cleaning and periodic inspections are common — but major recurring costs are relatively uncommon for many homeowners.
Still, incorporating conservative maintenance assumptions strengthens ROI modeling.
When Solar ROI Becomes Extremely Attractive
Watch for this combination:
✔ High local electricity rates
✔ Strong incentives
✔ Favorable installation pricing
✔ Long home tenure
✔ Good solar exposure
When these align, solar can rival returns from many traditional low-risk financial instruments.
Not guaranteed — but structurally compelling.
When ROI May Be Less Impressive
Solar is not universally optimal.
Returns often compress when:
❌ electricity prices are very low
❌ heavy shading reduces production
❌ installation costs are elevated
❌ incentives are minimal
❌ relocation is likely soon
Infrastructure investments reward stability.
The Tenure Question Most Buyers Underestimate
If you plan to remain in your home long enough to cross the payback threshold…
ROI tends to strengthen.
If you expect to move quickly?
Financial outcomes become more dependent on property market dynamics.
Solar often supports resale — but shouldn’t be assumed to fully convert into home value.
Executive Insight Most Homeowners Learn Later
Solar is not about chasing perfect ROI.
It is about locking in predictable energy economics in an environment where utility pricing is rarely predictable.
Certainty has value.
Even beyond spreadsheets.
What This Page Is — And What It Isn’t
This page IS:
- a financial modeling guide
- a payback explainer
- an ROI reality check
This page is NOT:
- investment advice
- a savings guarantee
- a personalized projection
Use it as a framework — not a promise.
Where Smart Buyers Go Next
Build your decision stack methodically:
👉 Solar Loan Rates
👉 Solar Installation Process
👉 Solar Incentives by State
Clarity compounds — especially with long-horizon assets.
FAQs
What is the average ROI for solar panels?
Many residential systems reach payback in roughly 6–12 years, though outcomes vary based on cost, incentives, and electricity rates.
Do solar panels increase home value?
Owned systems can influence buyer perception, but resale impact varies by market.
Is solar still worth it if I finance?
It often can be — particularly when projected savings exceed borrowing costs — but modeling is essential.
What reduces solar ROI the most?
High installation costs, weak incentives, shading, and short home tenure commonly influence outcomes.
Do panels keep generating value after payback?
Many systems continue producing electricity for years beyond cost recovery, extending financial benefit.